When you have created several reports and charts then you can create dashboards which can show several reports on one page. Dashboard page with all key reports about the specific business area can provide a quick overview of the current business status and key performance indicators.
If you would like to share your reports on some web page using iframe or post them on big screens using wallboard option, or send on email, first, create dashboards in eaazyBI. And only then you can share this dashboard as you see fit.
On this page:
- Create a new dashboard
- Page filters for dashboard
- Dashboard email subscription
- Export and import dashboard definitions
- Export to PDF
| Table of Contents |
|---|
Create a new dashboard
Go to eazyBI flex.bi tab Dashboard and chose option Create new dashboard or New. Then enter the name of the dashboard [1], add reports you would like to include [2] and save changes [3].
...
You can adjust the placement of reports by dragging and dropping them, inserting a page break [4] (if "Export to pdf" is installed) between reports, remove frame [5], align on the left or right side of the dashboard [6], and change report relative width [7].

By default, eazyBI flex.bi dynamically calculates the height of the reports. You can change and fix the report height [8] when editing the dashboard (available starting from the eazyBI version 6. 2). If you show several reports on the same row then adjust them to the same height to ensure that they are always aligned when changing the browser window size.
Click Reset to default [9] to return to the automatic report height calculation. Don't forget to save the changes of the dashboard layout.
...
Dashboard email subscription
Automatic dashboard sending to email is available in for following eazyBI products:
- eazyBI for Jira Server (see instructions for enabling Export to PDF),
- eazyBI for Jira Cloud,
- eazyBI for Confluence Server (see instructions for enabling Export to PDF),
- eazyBI for Confluence Cloud,
- eazyBI Cloud STANDARD and PLUS subscription plans,
- Private eazyBI (see instructions for enabling Export to PDF ).
You can subscribe to receive a regular email of your dashboards from the menu.
...
You can customize the text in email body when eazyBI for Jira Server or eazyBI Privateor flex.bi Enterprise is used.
Export and import dashboard definitions
If you have several eazyBI flex.bi accounts or several eazyBI flex.bi environments (development, test, production) then you can export dashboard definition from one eazyBI flex.bi account and import into another. Exported dashboard definition includes all report and calculated member definitions that are used and needed for this dashboard as well as report layout in dashboard and common page filters.
On the dashboard header toolbar, click on the Export definition [1] to copy the layout of currently selected dashboard or Export definitions of all dashboards [2] to copy all visible dashboard from current eazyBI flex.bi account.
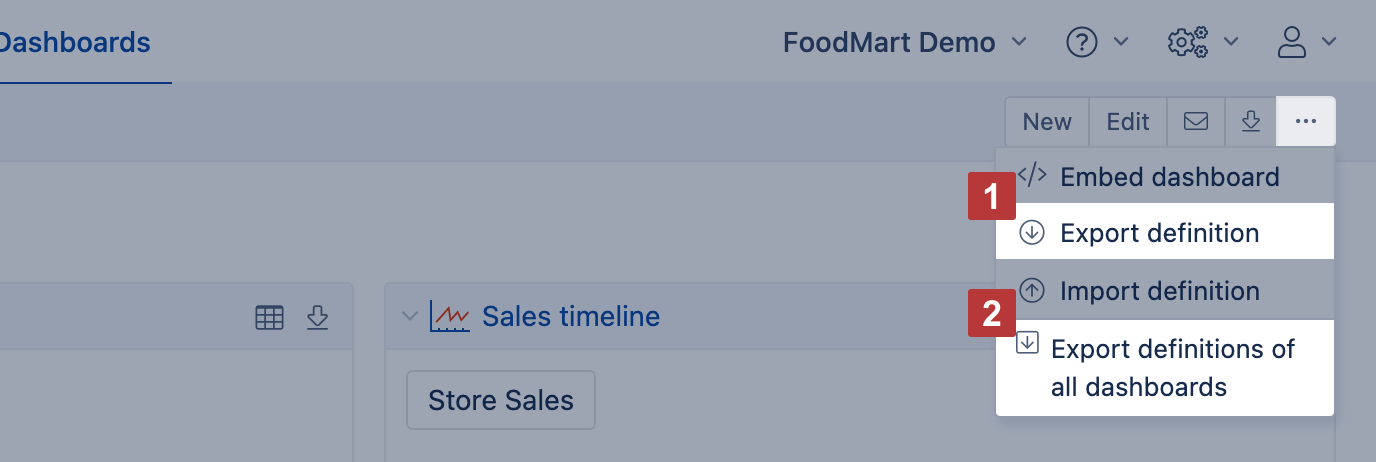
You will see dashboard definition in JSON format, please copy this definition for pasting it in the other eazyBI flex.bi environment.

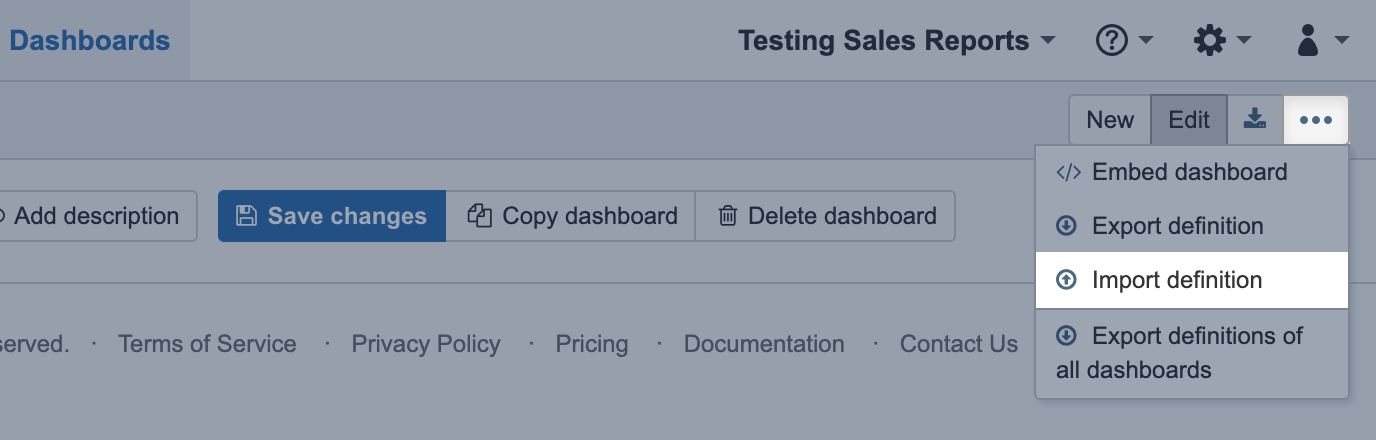
Now you can visit the other eazyBI flex.bi account where you would like to import one or several exported dashboards and chose option Import definition.
In Import dashboard definition dialog paste previously copied one or all dashboard definitions and click OK.
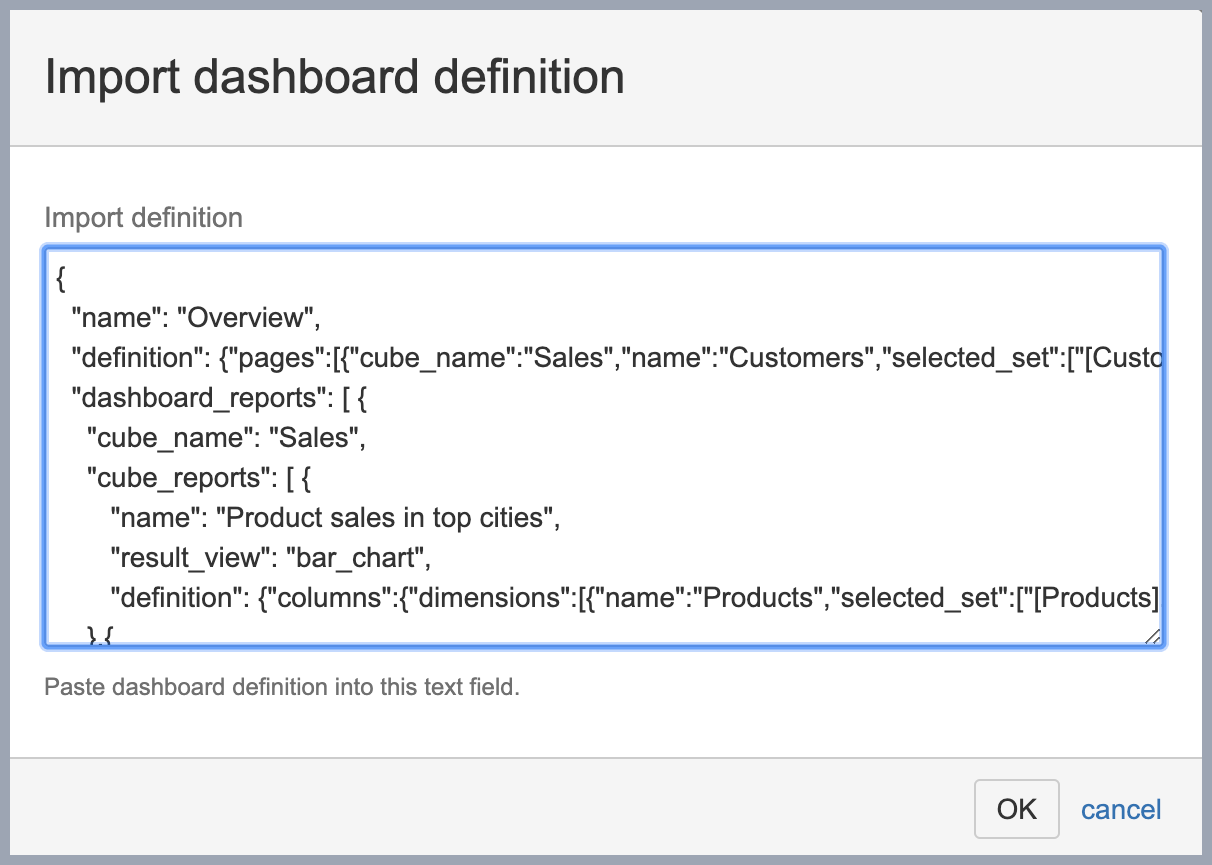
After import will be done you will be able to see and use imported dashboards in the new eazyBI flex.bi account.
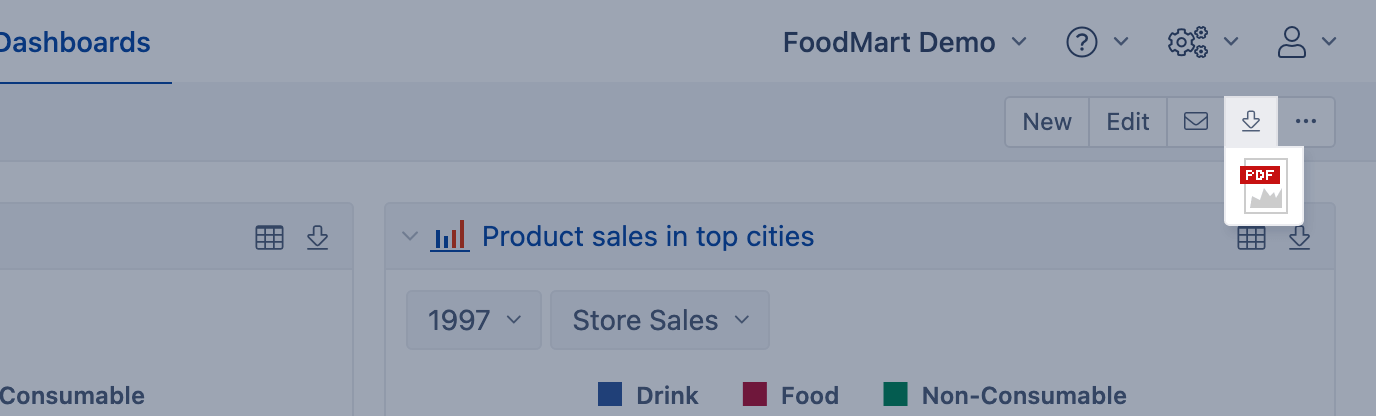
Export to PDF
You can export a dashboard to PDF. If you use eazyBI for Jira Server, eazyBI Private, or eazyBI for Confluence flex.bi Enterprise and do not see this option, contact your Jira administrator or eazyBI flex.bi administrator and ask to install Google Chrome on eazyBI flex.bi server.