If you import your data from CSV, MS Excel, SQL databases, Google Sheets or REST API, you will have to map your data columns to flex.bi data cube.
Data mapping is the process where you assign “data columns” from imported data to Dimensions, Measures, and Properties of a multi-dimensional data cube (for supported applications it is done automatically so you don't have to).
Simply put “Dimensions” are different ways to see your data (i.e., by month, by the company, by type, etc.), but “Measures” are the numerical facts describing those dimensions (i.e., revenue by month). Properties are dimension member attributes which can be added and further used in the reports if those dimension members are displayed in the report.
There are a few simple rules you have to follow while mapping your data:
Rule #1 – At Least One Measure
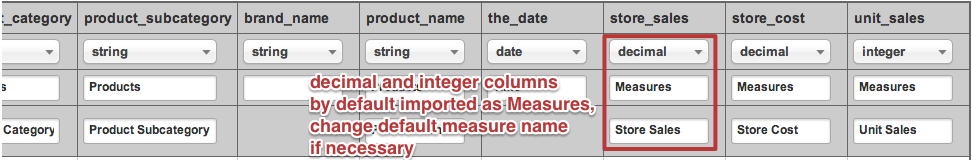
There must be AT LEAST ONE “Measure” (a “Dimension” with a name “Measures”), holding decimal or integer values. You can have more than one “Measure,” but remember to give each of them a unique name in the “Level or Measure” row. Read more...
Rule #2 – Only One Time Dimension
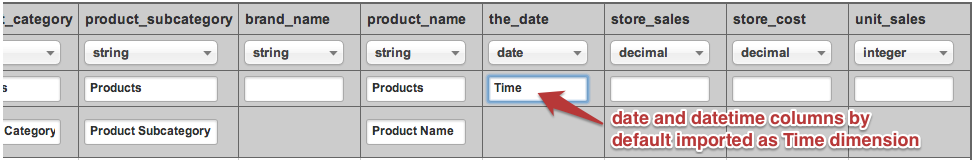
There can be ONLY ONE “Time” dimension for each multi-dimensional data cube. For this dimension, choose the column that holds chronological date stamps for your data. flex.bi will auto-magically create “Day,” “Week,” “Month,” “Quarter,” and “Year” hierarchies of your “Time” column.
You can import several columns with DateTime as properties with count measures mapped to Time dimension, only rows count with this DateTime will be improted as counter mapped to Time dimension. See more in Rule #4 - Import properties.
You can, of course, import more than one dimension, holding DateTime values, but those columns should be named differently (not Time), and no hierarchies will be created automatically for these columns. Still, you’ll be able to use these values in your reports and calculations. Read more...
Rule #3 – Hierarchical Order
You can create hierarchical “Dimensions” from your data, such as:
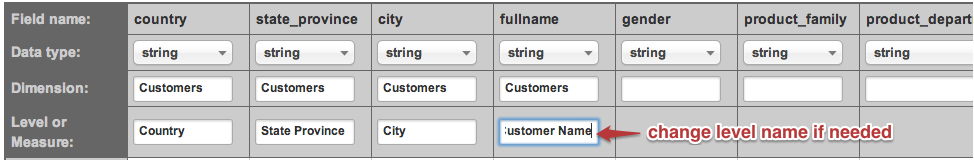
“Country” > “State Province” > “City” > “Customer Name”
This will let you see a TOP level overview of your data and drill into details when necessary.
To do that you have to enter the same “Dimension” name (i.e., “Customers”) for all hierarchical levels and a unique name for every hierarchy level in the “Level or Measure” row. Read more...
IMPORTANT! To make your hierarchical structure work, your data columns have to be ordered from left to right, starting with TOP level and down to the most detailed. For example, your first column would be “Country,” the second column, “State Province,” and the third column “City,” and so forth.
Rule #4 - Import properties
Properties are dimension member attributes which can be added and further used in the reports if those dimension members are displayed in the report.
Values usually are imported as properties if they are specific for each member (not classified), for example, description, comments, additional information, specific dates etc that might be not valuable to analyze all data by.
For instance, if we have customer date of birth attribute in data set and some customer comment, we can import these both as properties for the customer. Then these values could be displayed in the report if Customers dimension Fullname level would be selected in rows.
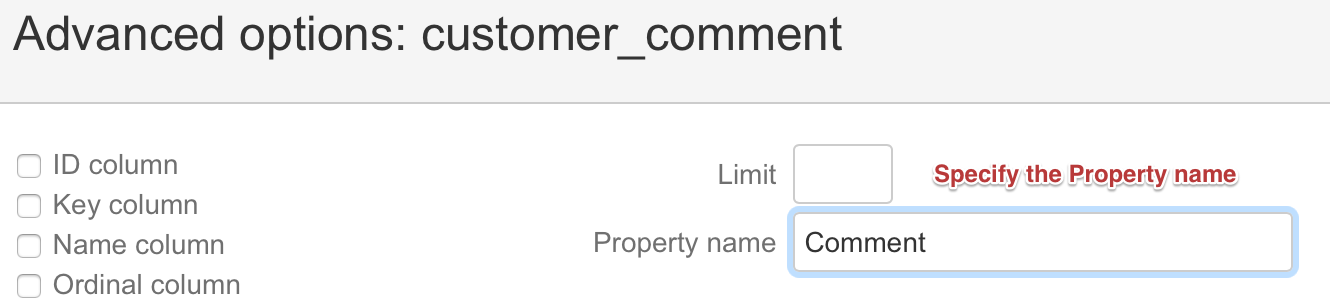
Define the property in data mapping for the Customer comment and Customer Birth date:
Specify the property name in the Advanced options:
It is possible to use a date field as a property and also define a new measure to count values over time. For instance, if we have some transaction cancellation date, we can add this date as a property in data mapping and use advanced options to define a new measure that would count all entries with the same date to corresponding Time dimension member:

Property values are visible in reports when the dimension is expanded to the respective level of hierarchy where the property is defined:

If the Date count measure and Date count dimension options are specified for a date Property, it is possible to use the new measure to count the Property value by Time dimension:

Changes in mapping
Correct data mapping sometimes require several tries with some fails before you got the required result. You would like to clean up the previous attempts and always start from a clean spot.
You would like to delete a cube before any changes in dimension mapping. You can add additional measures and properties without deleting a cube. Please open analyze tab and select an option Delete for a cube you would like to delete previous mapping.

Please export all reports / dashboards before deleting cube. Deleting cube will delete any calculation, reports, and dashboards from your account.In source file preview screen you can enter data cube name where you would like to import your data. If this is new data set then enter new cube name (e.g. Sales cube if you are importing sales transactions). You can also import new file in existing data cube - in this case you can use either existing cube dimensions and measures or specify new ones (which will be added to existing cube during import).
It is recommended that CSV file has header row with column names - eazyBI will try to detect if your CSV file has header row or not. If eazyBI has detected it incorrectly then please change number of header rows (e.g. specify 0 if you do not have any header row).
eazyBI will try to detect each source file column data type based on first 100 rows of source file. Detected column types (string, integer,decimal, date or datetime) are shown below each column name. If some column type is detected incorrectly then you can change it (e.g. change from integer to string if this column might contain also non-integer values).

Column mapping to dimension and dimension level
Next you need to map source file columns to cube dimensions and measures.
By default eazyBI will suggest to map string columns to dimension with name which is derived from column name (underscores replaced with spaces, each word is capitalized). If necessary then you can enter different dimension name that you would like to use in eazyBI.

You can map each column to separate dimension but sometimes it would be better to map several columns to the same dimension but different hierarchy levels. E.g. in this example it would be better to map country, state_province, city and fullname to the same Customers dimension with hierarchy levels Country (highest hierarchy level), State Province (one country expands to several states or provinces), City (one state or province expands to several cities), Customer Name (one city expands to several individual customers). It is important that in source file hierarchy level columns are always in the sequence from highest hierarchy level to lowest hierarchy level.

When you map several columns to the same dimension then you can select existing dimension name from list for next columns (delete suggested default dimension name to see list of available dimension names).
If you map several columns to the same dimension then it is mandatory to specify dimension hierarchy level for each column. By default hierarchy level name will be generated from column name (in the same way as default dimension name). If necessary then you can enter different dimension hierarchy level name.

Ignore columns
If you would like to ignore some columns during import (do not want that these columns are imported) then you should leave dimension selection blank for this column.

Time dimension
Date or datetime column by default will be mapped to Time dimension. Time dimension after import will automatically create year, quarter,month and day hierarchy levels as well as additional weekly hierarchy with year, week and day hierarchy levels. Therefore you should not provide any dimension hierarchy level information in source file mapping as time hierarchies will be created automatically.
You should use one of the following date formats in your CSV file that eazyBI will recognize as date format and you will be able to import it as Time dimension:
- YYYY-MM-DD
- YYYY.MM.DD or DD.MM.YYYY
- YYYY/MM/DD or MM/DD/YYYY
The following datetime formats are recognized (currently only date portion of datetime value will be imported in Time dimension):

Measures and integer and decimal columns
Numeric columns (integer and decimal data types) by default will be mapped to Measures and you need to specify measure names for these columns (by default derived from column names). Measures are values that you would like to analyze across other dimensions and which will be aggregated by other dimensions hierarchy levels.
If you have other integer values (most typically e.g. identifier columns like customer ID or order ID etc.) in source file columns then do not map them to Measures - either enter corresponding dimension name or leave dimension name blank to ignore them during import.
