| Wiki Markup |
|---|
{style}#com-atlassian-confluence .wiki-content td {
border: none;
}
{style} |
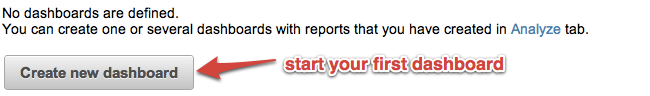
When you have created several reports and charts , charts and learned about calculated members then you can create dashboards which can show several reports on one page. Dashboard page pages with all key reports about specific business area areas can provide s quick overview of the current business status and key performance indicators.
You can try also view the sample Sales demo dashboards page.
Create new dashboard page
...
Go
...
to
...
Dashboards
...
tab
...
and
...
click
...
Create
...
new
...
dashboard
...
button.
...
...
...
...
...
| Wiki Markup |
|---|
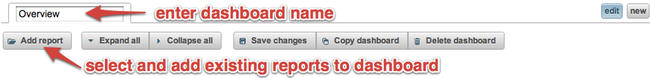
{align:justified}Specify new dashboard name and select existing reports that you would like to include in dashboard. {align} |
...
...
...
...
...
...
...
...
| Wiki Markup |
|---|
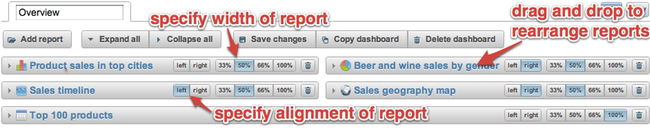
{align:justified}You can easily arrange reports in dashboard by
* specifying their width in percentage from all page
* specify if they should be aligned to left or right side of page
* rearrange reports using drag-and-drop\\
{align} |
...
...
...
...
...
...
...
...
| Wiki Markup |
|---|
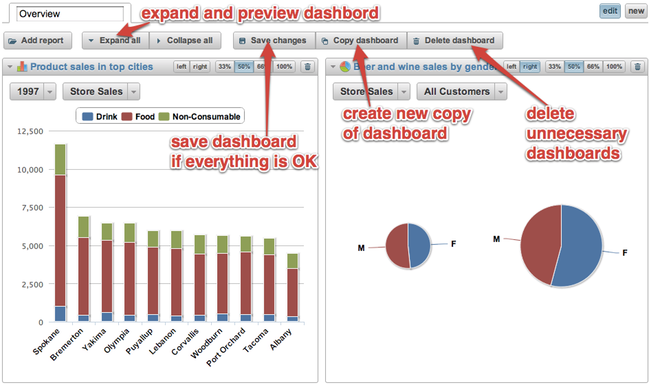
{align:justified}\\
After initial arrangement you can expand all reports and preview dashboard. If everything looks good then you can save report or if needed then continue to rearrange reports as needed. You can also create a copy of existing dashboard (if you would like to create another dashboard page with some modifications) or delete unnecessary dashboards. {align} |
...
...
...
...
...
...
...
...
Specify a new dashboard name and select some existing reports that you would like to include in your dashboard.
You can easily arrange reports in a dashboard by
- specifying their width in percentage from the page width
- specify if they should be aligned to the left or right side of the page
- rearrange reports using the drag-and-drop function
After the initial arrangement you can expand all reports and preview the dashboard. If everything looks good then you can save the report or continue to rearrange reports as needed. You can also create a copy of an existing dashboard (if you would like to create another dashboard page with some modifications) or delete the unnecessary dashboards.
After saving a dashboard the dashboard will then have a unique URL address (e.g. sample demo dashboard have URL address https://eazybi.com/accounts/1/dashboards/overview
...
).
...
You
...
can
...
bookmark
...
this
...
URL
...
in
...
your
...
browser
...
for
...
faster
...
access
...
.
If you later want to edit the dashboard layout then either double-click on the dashboard title or click the edit button or use the new button to create additional dashboard pages. You can also rearrange the sequence of dashboard pages by using the drag-and-drop
...
function (when
...
in
...
dashboard
...
edit
...
mode).
...
...
...
Common
...
dashboard
...
page
...
dimensions
...
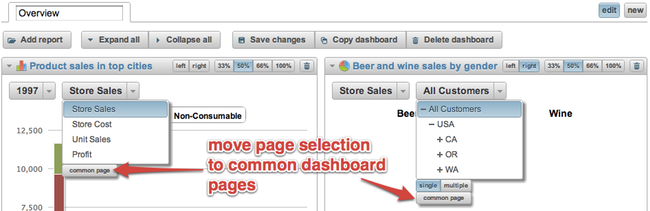
...
...
After
...
saving
...
the dashboard
...
you
...
can
...
select
...
the dashboard
...
page
...
dimension
...
members
...
and
...
all
...
of the reports
...
which
...
use
...
this
...
page
...
dimension
...
will
...
refresh
...
...
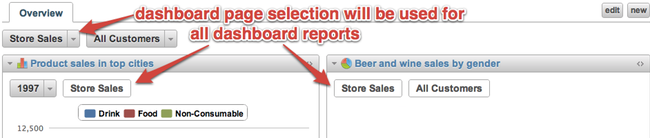
...
...
the results.
When you save a dashboard then all of the current common dashboard page selections are saved as well for this dashboard (andthis dashboard will override default page selection in the included reports). All non-common report page dimensions after the dashboard page refresh will use default report page selection.