Support center for flex.bi version 3.2
Creating reports
- Juris Aidma (Deactivated)
- Dace Kvalberga
- Former user (Deleted)
Creating Reports
This short tutorial shows the main steps that you need to take to start analysing your uploaded or imported data and create and save reports.
Go to the Analyse main tab and follow these instructions. You can also try these steps in demo data cube.
Drag dimensions to columns and rows
In this example we would like to analyse who are our best customers based on sales amounts.
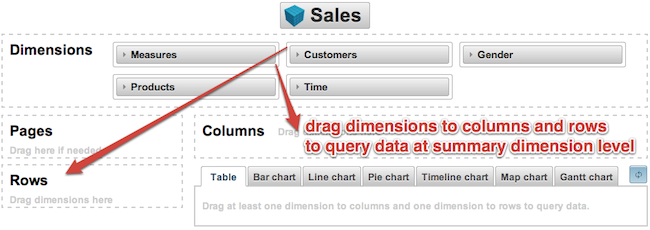
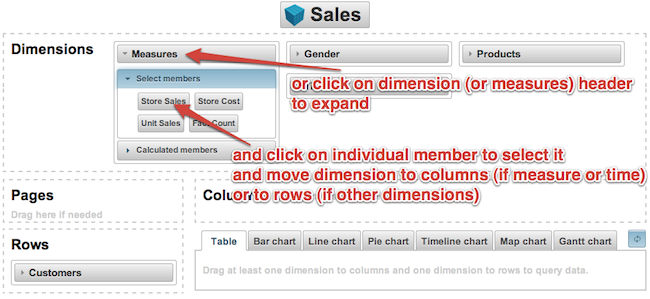
We will select two dimensions - the customers dimension which we will drag into the Rows section and the Measures dimension which we will place into the columns section.
If you have several measures then instead of dragging all measures to columns you can select them by clicking on them and they will automatically appear in the columns section.
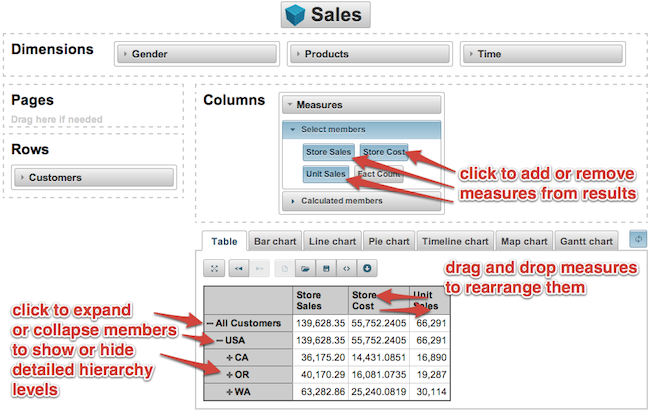
Expand and collapse, rearrange measures
You can expand and collapse selected dimension members to show detailed hierarchy level members (e.g. start with all customers and expand into countries, regions or states, cities and individual customers). You can add or remove selected measures in columns or rearrange them with drag and drop.
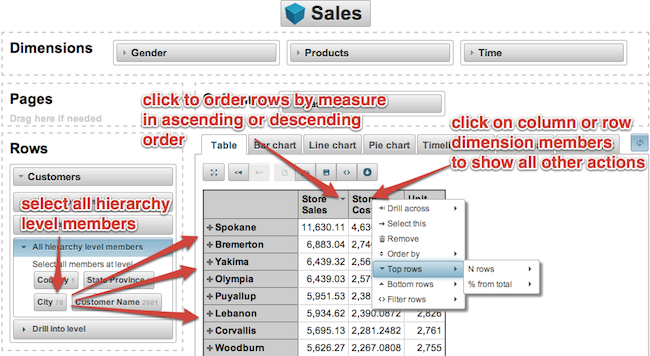
All hierarchy level members, member actions
Instead of expanding hierarchy levels from the top you can select all hierarchy level members (e.g. all cities). And then you can order them by the selected measures or select any other available member actions (e.g. drill into lower hierarchy levels, drill across another dimension, select only one member or remove selected member, select top or bottom rows based on selected measure or filter rows by specified condition).
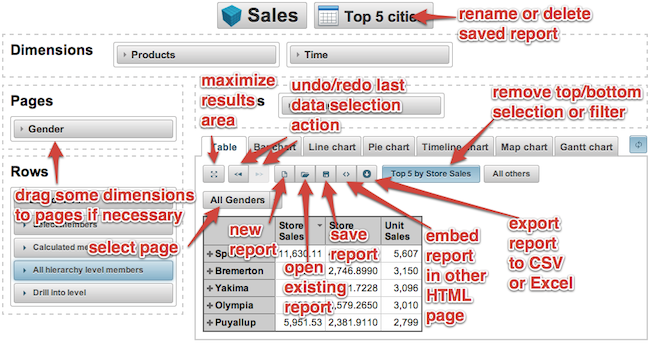
Page dimensions and toolbar buttons
If necessary you can drag some dimensions to pages as well and then select one dimension member in page section to see the corresponding results. There are several buttons in the toolbar that you can try out (maximise, undo, redo). When you have created a report that you would like to use later, save it and give it a name. You can rename or delete saved reports later as well and you can embed reports in other HTML pages or export report to CSV and Excel formats.
Calculated members
You can learn about calculated members here.
Creating charts
Please continue to creating charts help page.