Support center for flex.bi version 4.0
Calculated measures and members (MDX)
- Laima (Deactivated)
- Gvido
- Inta (Deactivated)
If you have not yet introduced yourself to the basic concepts of flex.bi then please start with an overview of flex.bi concepts and learn how to analyse and create reports. This tutorial will explain how to define new calculated members using MDX calculation formulas.
Available materials: |
|---|
MDX programming basics (video): MDX programming basics (presentation): |
30 most popular MDX functions (video): 30 most popular MDX functions (presentation): |
Dimensions and hierarchies
Each cube dimension contains one or more hierarchies with one or more hierarchy levels. And each hierarchy level contains dimension members. There are normal members which are imported from source files or applications as well as you can define calculated members using calculation formulas. Calculation formulas are defined using MDX query language.
There is special dimension Measures which contains all imported measures. Most frequently calculated members are defined in Measures dimension and then they are typically called as calculated measures.
Define new calculated member
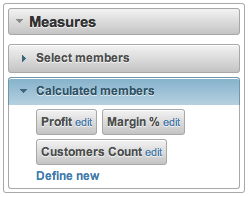
If you would like to define new calculated members then expand the corresponding dimension (e.g. Measures) and expand the Calculated members section:
On This Page:
If you would like to define a new calculated member then click on the "Define new" link, if you would like to edit (or delete) existing calculated member then click on the " edit" link. If you do not have rights to edit calculated members in the current account then you will see a " show" link instead of an "edit' link. Without the option the edit a calculated member you can only see the definition of existing calculated members. When you define a new member or edit an existing calculated member you will see the following calculated member definition form:
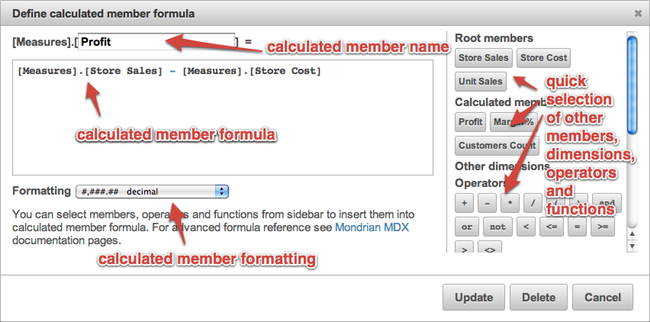
Each calculated member should have a name (unique within dimension) and a calculation formula (the rest of tutorial will teach how to write calculation formulas). In addition you can specify how the calculated member values should be formatted (e.g. as integer, decimal, date or using default formatting). From the right sidebar you can quickly select other members, dimensions, operators or functions to insert them into the calculation formula.
After defining the calculated member formula press Update to save your work or Delete to delete the currently opened calculated member or Cancel to discard any changes and close the window. If the calculated member formula is invalid then a corresponding error message will be displayed.
Do not modify or delete pre-defined calculated members that were created by the source application import - their original definition will be recreated next time you will perform the source application import. If you need to create a modified version of existing pre-defined calculated member then copy its calculation formula and create a new calculated member with a different name and modify copied calculation formula for the new calculated member.
Let's start writing some calculation formulas! The following examples will use data from the Sales reports cube dimensions and measures to illustrate how to write the calculation formulas.
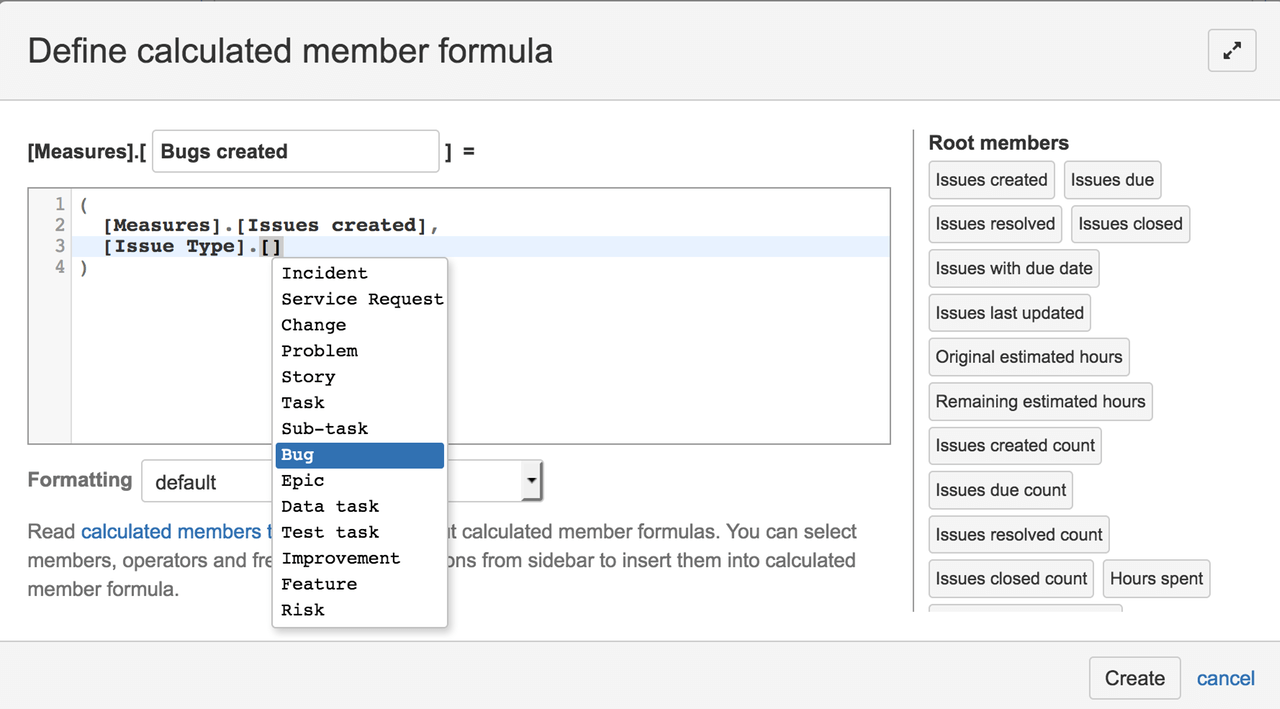
MDX autocomplete function allows you to see available functions and their parameters while writing the MDX. Just start typing measures, member names, functions and flex.bi will provide autocomplete options. For functions, we will show both name and all parameters. You can access both the default as well as user-defined measures. You can get any member names there as well.
Dimension, hierarchy, level and member names
When writing calculation formulas you will need to reference dimensions, dimension hierarchies, hierarchy levels and other existing dimension members. In the MDX query language all names are enclosed in square brackets [].
To reference a dimension you just enclose its name in square brackets, e.g.
[Customer]
, [Time] or [Measures] .
If a dimension has just one hierarchy then you can reference the primary hierarchy in the same way as a dimension, e.g. [Customer] or [Measures] . When you import the Time dimension then it will automatically create the main hierarchy (year, quarter, month and day levels) as well as a Weekly hierarchy (year, week and day levels). Time will reference the Time dimensions main hierarchy but Time.Weekly will reference the Time dimensions Weekly hierarchy.
When you expand the All hierarchy level members then you see names of all the main hierarchy levels . You can reference a particular hierarchy level with [dimension or hierarchy name].[level name] . E.g. [Customer].[City] references the City level of the main hierarchy of the Customers dimension.
When referencing the Time dimension use [Time].[Year], [Time].[Quarter], [Time].[Month], [Time].[Day] to reference the main hierarchy levels and [Time].[Weekly].[Year], [Time].[Weekly].[Week], [Time].[Weekly].[Day] to reference the weekly hierarchy levels.
Each dimension typically will have a default All member which can be used to get totals of measures per this dimension. If the Customers dimension has a default All member named a All Customers then you can reference it with [Customer].[All Customers] . Since the default All member can be renamed it is safer to use [Customer].DefaultMember to get the same result. The time dimension has two default All members for each hierarchy - [Time].DefaultMember and [Time].[Weekly].DefaultMember .
When you want to reference the top level dimension members then you have to use the following format - [dimension of hierarchy name].[member name] . E.g. [Customer].[USA] will reference the USA member from the top level of the Country level. To reference detailed level dimension members * you need to specify the full "hierarchy path" to this member, e.g. [Customer].[USA].[CA] to reference the CA member in the State Province level under the USA parent member. Or [Customer].[USA].[CA].[San Francisco] to reference a city etc.
All measures are in the top level of the Measures dimension and you can reference them with e.g. [Measures].[Store Sales] , [Measures].[Store Cost] etc.
Selecting specific members
To get a correct syntax for selecting specific members it is recommended to use the "bookmark" functionality.
Simple arithmetic calculations
Now that you know how to reference other existing measures and other dimension members we can create simple arithmetic calculations.
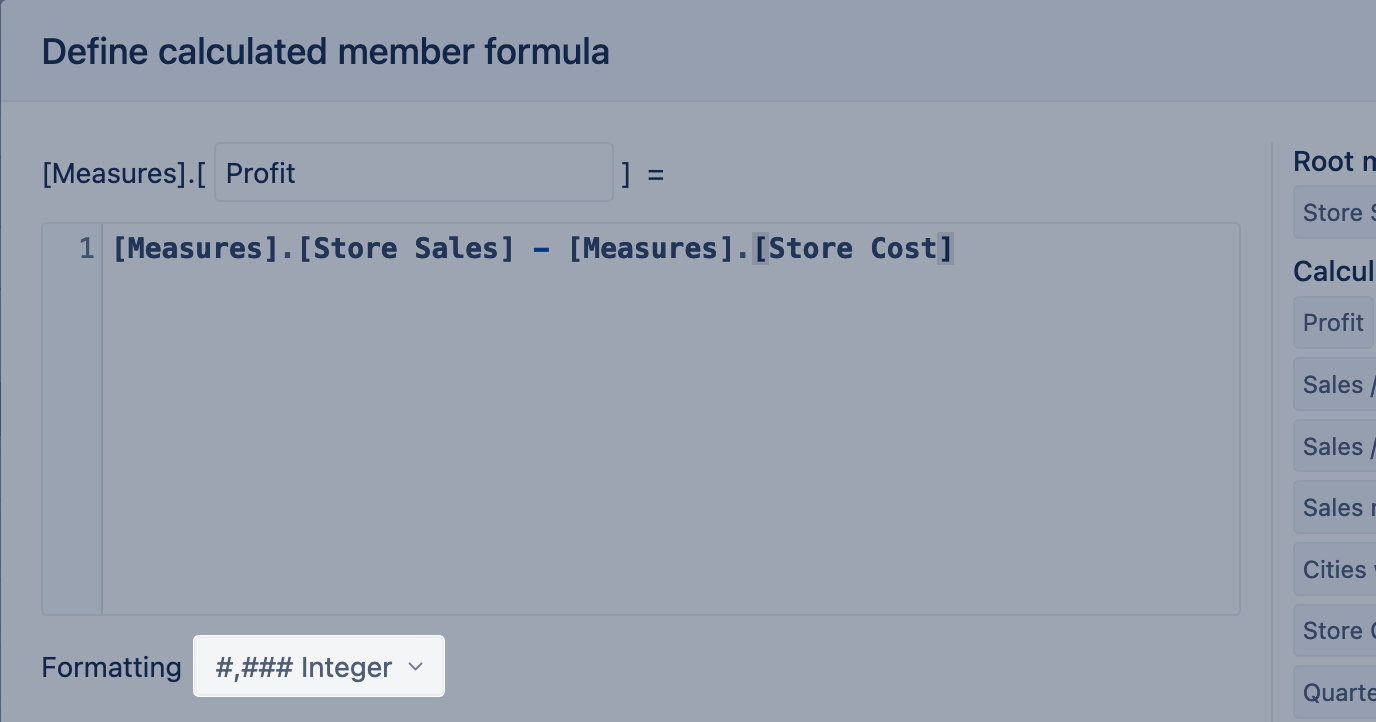
If we have the [Measures].[Store Sales] and [Measures].[Store Cost] measures then we can define a new calculated measure - Profit (which will have the full name [Measures].[Profit] ) with the formula:
[Measures].[Store Sales] - [Measures].[Store Cost]
When you use the new Profit measure in your flex.bi reports then this formula will calculate the difference between the Store Sales measures value and the Store Cost measures value.
You can also use calculated measures in other calculated measures ( it is important to define them in the right sequence - you can only use existing calculated members ). For example, you can now define [Measures].[Margin %] with the formula
[Measures].[Profit] / [Measures].[Store Sales]
and it will calculate the margin as a number from 0 to 1. If you would like to display the results as a percentage then change the Formatting of this calculated measure to use integer or decimal percentage formatting.
You can also perform arithmetic calculations for calculated members in other dimension. For example, you could define [Customer].[West coast] calculated member in the Customers dimension with the formula
[Customer].[USA].[CA] + [Customer].[USA].[OR] + [Customer].[USA].[WA]
and now when you combine the calculated members in reports [Customer].[West coast] with [Measures].[Store Sales] you will get the total sales for all these three states together. If you combine it with [Measures].[Profit] you will get the total profit for all these three states.
There is a default hidden [Measures].[Fact Count] measure which will return number of fact rows in a cube database table. You can use it to calculate simple average values, for example, define [Measures].[Average Store Sales] as
[Measures].[Store Sales] / [Measures].[Fact Count]
Tuples
When you use [Measures].[Store Sales] in a formula then it will calculate Store Sales measure value for the current context of each report cell. Current context includes corresponding row and column dimension members of the report cell as well as selected page dimension members.
If you would like to override in a measure value calculation some current context dimension member with a different member then you need to use a tuple of this measure and other dimension member (or several dimension members). MDX syntax for tuples is (member_1, member_2, ..., member_n). For example, if you would like to get Store Sales measure value for all customers then in a formula you should use a tuple:
( [Measures].[Store Sales], [Customer].DefaultMember )
This formula means that Store Sales should be calculated using all dimension members from the current context except Customers dimension for which default member (All Customers) should be used.
Tuples are frequently used to calculate percentage of a measure value from some total value. Let’s define a calculated measure [Measures].[Sales / customers total %] with a formula (and percentage formatting)
[Measures].[Store Sales] / ([Measures].[Store Sales], [Customer].DefaultMember)
When in report you combine [Measures].[Sales / customers total %] with, for example, [Customer].[USA].[CA] then you will see percentage of California sales from the total customer sales.
Maybe you don’t want to see a percentage from the total sales but a percentage from customer hierarchy direct parent sales (e.g. for City level show percentage from corresponding State sales). In this case you can use the CurrentMember dimension or hierarchy property to access the current context dimension member. For example, [Customer].CurrentMember will return the current member in the Customers dimension for which the formula is evaluated. Or in other words if Customers dimension is placed on report rows then by using [Customer].CurrentMember we know for which row the formula is evaluated.
If we have the current member then we can navigate to other dimension members relative from this member. [Customer].CurrentMember.Parent will return parent member in Customers hierarchy for the current member. Ancestor([Customer].CurrentMember, [Customer].[Country]) will move from current member up to “ancestor” in Country level.
So we can define a calculated measure [Measures].[Sales / parent customer %] with a formula:
[Measures].[Store Sales] / ([Measures].[Store Sales], [Customer].CurrentMember.Parent)
Please see also DefaultContext function documentation which can be used to override the context for evaluation of measures.
Moving in time
As you can move to a different dimension hierarchy levels you can also move to a different dimension members in the same dimension. It is typically used in the Time dimension when you want to compare measures between different time periods or aggregate a time period range.
For example, a calculated measure [Measures].[Sales monthly growth] with a formula:
[Measures].[Store Sales] - ([Measures].[Store Sales], [Time].CurrentMember.PrevMember)
will calculate a [Measures].[Store Sales] growth comparing to the previous Time dimension member period. If this calculated measure will be combined in a report with a month in the Time dimension then it will show a growth comparing to the previous month. If it will be combined with a year then it will show the growth comparing to the previous year.
There are several functions that will help you “to move in time”:
[Time].CurrentMember.PrevMemberreturns the previous member, which contains data, in the same hierarchy level (it will return an empty member for the first member)[Time].CurrentMember.NextMemberwill return the next member[Time].CurrentMember.Lag(2)will return the previous member with a distance 2 (use any number for the argument,Lag(1)is the same asPrevMember)[Time].CurrentMember.Lead(2)will return the next member with a distance 2 (Lead(1)is the same asNextMember)ParallelPeriod([Time].[Year], 1, [Time].CurrentMember)will return the “parallel” Time member one year ago (e.g. for the Day level memberJan 01 2012it will be the dayJan 01 2011but for the Month level memberJan 2012it will be the monthJan 2011)OpeningPeriod([Time].[Day], [Time].CurrentMember)will return the first descendant of the current Time member at the Day level (the first day of a year, a quarter or a month which is defined in the Time dimension)ClosingPeriod([Time].[Day], [Time].CurrentMember)will return the last descendant of the current Time member at the Day level (the last day of a year, a quarter or a month which is defined in the Time dimension)
If cube has only one Time dimension then the [Time].CurrentMember argument can be omitted as it will be used by default. So you can use shorter expressions ParallelPeriod([Time].[Year], 1) , OpeningPeriod([Time].[Day]),
.ClosingPeriod([Time].[Day])
Sometimes you would like to test if your time navigation expression is working as you expect (before using it in further calculations). Then you can use .Name member property to get a member name as a calculation formula result. For example, define calculated measure [Measures].[test opening day] with a formula:
OpeningPeriod([Time].[Day], [Time].CurrentMember).Name
and use it in report together with the Time dimension members and see if you get the expected result for the Time dimension members at different levels.
Sets
Now you know how to navigate to individual dimension members. But quite often you would like to perform operations on a set of dimension members. For example, you would like to get a sum or an average value of some measure over a selected set of dimension members.
The easiest way how to use sets in calculation formulas is to use list of members enclosed in curly braces, e.g.
{[Customer].[USA].[CA], [Customer].[USA].[OR], [Customer].[USA].[WA]} {[Time].[2011], [Time].[2012]}
If you would like to select a set as a range of sequential dimension level members then you can specify the first and the last member and use : between them. For example, this will create a set of dates from Jan 01 2012 to Jan 15 2012 :
[Time].[2012].[Q1 2012].[Jan 2012].[Jan 01 2012]:[Time].[2012].[Q1 2012].[Jan 2012].[Jan 15 2012]
Quite often you don’t want to specify the exact range of members but would like to get all dimension hierarchy level members. You can do it with Members method. This will get all months in the Time dimension:
[Time].[Month].Members
When you want to test which members will be returned by some set expression then you can use the SetToStr function to create a string of concatenated member full names. For example, define a calculated measure [Measures].[test all months] with a formula:
SetToStr([Time].[Month].Members)
There are several other useful functions for working with sets. Here are some examples how to use them:
[Customer].[USA].[CA].Childrenreturns a set of children members using a dimension hierarchy (in this example all cities in California)Descendants([Customer].[USA], [Customer].[City])returns set of member descendants at the specified hierarchy level (in this example all cities in USA)[Customer].[USA].[CA].[San Francisco].Siblingsreturns all members which have the same parent as this member (in this example all cities in California), it is the same as using[Customer].[USA].[CA].[San Francisco].Parent.Children
There are additional methods that you can use to get just the first or the last member of these sets – FirstChild, LastChild, FirstSibling, LastSibling.
Sets of time periods
There are additional useful set selection methods for Time periods
PeriodsToDate([Time].[Year],returns all periods from the beginning of the current member in the specified level (in this example from the beginning of the current year) until the specified member.[Time].CurrentMember)YTD([Time].CurrentMember)is a shorter version of the same function (an abbreviation from Year-to-date).
Note that even though Weekly hierarchy also has Year level, this function will only work in default Time hierarchy. For weekly hierarchy use thePeriodsToDate([Time.Weekly].[Year]).QTD([Time].CurrentMember)returns a quarter-to-date set of membersMTD([Time].CurrentMember)returns a month-to-date set of membersWTD([Time.Weekly].CurrentMember)returns a week-to-date set of members
As mentioned earlier If you have just one Time dimension in your cube then you can use even shorter expressions YTD(), QTD(), MTD() and WTD() as by default they will receive as an argument the current member of the time dimension – [Time].CurrentMember. But sometimes you need to pass a different argument to these functions. For example, if you would like to compare current year-to-date aggregates with year-to-date aggregates a year ago then you can use the following expression to get a year-to-date set for the corresponding Time dimension member a year ago:
YTD(ParallelPeriod([Time].[Year], 1, [Time].CurrentMember))
And if you like shorter expression then you can omit the current member argument here as well – YTD(ParallelPeriod([Time].[Year], 1)) . Most of the time related functions will use [Time].CurrentMember as a default member argument.
If you want to get a number of last periods from the Time dimension then you can use the LastPeriods function. For example:
LastPeriods(3, [Time].CurrentMember)
will return a set with the current Time member and the two previous members. If you would like to get the current and the next two Time periods then use negative value -3 instead of 3. And you can omit the last argument for this function as well and use LastPeriods(3).
When you want to get the current Time dimension member in the Weekly hierarchy then you need to use [Time.Weekly].CurrentMember member expression. Sometimes you need to write a formula which should use either [Time].CurrentMember (when creating e.g. monthly report) or [Time.Weekly].CurrentMember (when creating weekly report). In this case you can use
[Time].CurrentHierarchyMember
Set operations
There are several operations that you can perform on sets:
{set1, set2, ..., setn}returns a union of two or more setsExcept(set1, set2)returns set1 members but removes any members that are in set2Head(set, number)returns a set with the first number of members from the original set (if number is not specified then a set from the first set member is returned)Tail(set, number)returns the last number of members from a setset.Item(position)returns one member from a set with the specified position (starting from zero). So if you would like to get the first member of a set you can use the expressionHead(set).Item(0)
Quite frequently you would like to filter set members using some condition. You can do this with Filter(set, condition). For example, in this way you can filter all cities with sales larger than 1000:
Filter([Customer].[City].Members, [Measures].[Store Sales] > 1000)
Within the condition expression [Customer].CurrentMember references the current set member for which the condition is evaluated. For example, this will return all cities which name starts with San (using MATCHES operator with regular expression)
Filter([Customer].[City].Members, [Customer].CurrentMember.Name MATCHES 'San .*')
Other typical function that is used in conditions is IsEmpty. This expression will return all cities which have non-empty sales amount:
Filter(  [Customer].[City].Members,
  NOT IsEmpty([Measures].[Store Sales])
)
Previously a simple set to string function SetToStr was mentioned that is useful for expression testing purposes. But if you would like to format set results in a customized way then you can use Generate(set, string_expression, separator_string) . For example, the following expression will return city names concatenated using comma where there is no sales amount recorded:
Generate(  Filter(
    [Customer].[City].Members,
    IsEmpty([Measures].[Store Sales])
  ),
  [Customer].CurrentMember.Name,
  ', '
)
Aggregates
Now that you know how to select different sets of dimension members you can calculate different aggregated values from these sets:
Sum(set, numeric_expression)calculates numeric_expression for each set member and returns a sum of all these results. For example,Sum(LastPeriods(3), [Measures].[Store Sales])will calculate the total sales for the last three Time periods starting from the current Time dimension member.Count(set)returns a count of set members.Count(set, ExcludeEmpty)will return a count of set members for which corresponding measure values are not empty.Avg(set, numeric_expression)calculates the average of numeric_expression in setMax(set, numeric_expression)returns the maximum value of numeric_expression in setMin(set, numeric_expression)returns the minimum value of numeric_expression in setMedian(set, numeric_expression)returns the median value of numeric_expression in set
Aggregate members in other dimensions
In the beginning of this tutorial we defined a [Customer].[West coast] calculated member in the Customers dimension with a formula:
[Customer].[USA].[CA] + [Customer].[USA].[OR] + [Customer].[USA].[WA]
But it would be better if we could expand or drill into West coast when using it in reports. To enable that you need to define calculated member using Aggregate(set) function. When you will combine such calculated member in a report together with other measure then you will get an aggregated result (by default a sum) of this measure over the specified set of members. So if you will define a [Customer].[West coast] calculated member with a formula
Aggregate({
  [Customer].[USA].[CA],
  [Customer].[USA].[OR],
  [Customer].[USA].[WA]
})
then you will get the same result as previously but in addition you will be able to expand or drill into West coast member and see the detailed results for CA , OR and WA .
In similar way you can aggregate more complex set expressions. For example, you could define [Customer].[US without west coast] calculated member with a formula:
Aggregate(  Except(
    [Customer].[USA].Members,
    { [Customer].[USA].[CA],
      [Customer].[USA].[OR],
      [Customer].[USA].[WA] }
  )
)
which will calculate aggregate of all US states without west coast states and you can drill into these states as well.
Conditions
You can write formulas with conditions using IIF and CASE functions. For simple IF / THEN / ELSE type of conditions use IIF(condition, if_true_expression, if_false_expression) (notice that there are two I letters in IIF), for example
IIF([Measures].[Profit] > 0, 'Profit', 'Loss')
If there are many conditions then it is easier to use CASE function, for example
CASE
WHEN [Measures].[Profit] > 1000
THEN 'Big profit'
WHEN [Measures].[Profit] > 0
THEN 'Small profit'
ELSE 'Loss'
END
If all conditions are comparisons of the same expression to different expected values then another CASE form can be used, for example
CASE Time.CurrentMember.Level.Name
WHEN 'Month'
THEN Sum(LastPeriods(3), [Measures].[Store Sales])
WHEN 'Day'
THEN Sum(LastPeriods(90), [Measures].[Store Sales])
END
In IIF and CASE conditions standard comparison operators can be used ( = , < , <= , <> , > , >= ) as well as AND , OR and NOT operators as well as several specific operators:
ISreturns whether two objects are the same, for example[Customer].CurrentMember IS [Customer].DefaultMember
(which will be true if Customers current member is default All Customers member)
INandNOT INreturns whether member is in a set, for example[Customer].CurrentMember IN [Customer].[USA].[CA].Children
Member properties
Dimension members has some default properties (like .Name and .Key) as well as they can have additional custom properties. flex.bi source application import (e.g. from Basecamp, Highrise or JIRA) are also importing additional dimension fields from source systems. MDX has standard Properties function to access member properties. flex.bi defines an additional get (and also with a longer name getProperty) function which will return an empty result instead of an exception if no property is defined for the current dimension level.
For example, JIRA import adds the Created at property for all imported issues. The following expression returns the Created at property value for the Issue dimension current member:
[Issue].CurrentMember.get('Created at')
Date type conversion
Sometimes you might need to convert string expression to an integer, a decimal or a date expression (for example, to convert Highrise custom field string value to corresponding type to be able to use it in further calculations). There are several functions available for data type conversions:
CInt(value)returns a value converted to an integerCDbl(value)returns a value converted to a double floating number type (should be used when results should be decimal)- flex.bi defines additional function
DateParse(value)which will try to convert value to a date value using different date formats (for example both2012-01-31andJan 31 2012will be converted to the correct date). There is a MDX standardCDatefunction but it supports less date formats. DateParsefunction also supports dynamic date expressions as offset from today (learn more about them in date filters help page). For example, you can useDateParse('today')orDateParse('30 days ago')orDateParse('1 week from now').
Time difference calculations
Flex.bi defines an additional function DateDiffDays(from_date, to_date) which will return a difference in days between two dates. It can be used together with Now() function (which returns the current time) to get a distance in days between selected Time dimension member and the current date, for example
DateDiffDays(DateParse([Time].CurrentMember.Name), Now())
In addition, flex.bi defines the function DateAddDays(date, number_of_days) which will return a new date in the past (if number_ of_ days is negative) or in the future (if number_ of_ days is positive). For example, this will return a date which is 5 days from the current Time dimension member
{[Date].DateAddDays(DateParse([Time].CurrentMember.Name), 5)
Sometimes it is useful to get the Time dimension member which corresponds to the actual current date. This can be done with flex.bi specific dimension hierarchy level property CurrentDateMember . For example, these expressions will return the members for the month of the current date and the week of current date:
[Time].[Month].CurrentDateMember[Time.Weekly].[Week].CurrentDateMember
If there is no Time dimension level member that corresponds to the current date (e.g. if data for current month or week are not yet imported) then CurrentDateMember will return the last period before the current date which is present in the Time dimension corresponding level.
There is also an additional flex.bi specific dimension hierarchy level method DateMember for which you can provide a dynamic date expression argument and get the corresponding member (or the last period before that date which is present in the Time dimension). For examples:
[Time].[Day].DateMember('7 days ago')
[Time].CurrentHierarchy.Levels('Day').DateMember('2017-10-01')
If you want to select a subset of Time dimension level members between specified dates then you can use DateBetween function to filter level members using a date range expressions. For example, the following expression will return set of last 7 days from [Time].[Day] level members:
Filter(  [Time].[Day].Members,
  DateBetween([Time].CurrentMember.StartDate,'7 days ago','today')
)
Default values
Sometimes you want to return a default value if some measure or function will return an empty value. In these cases you can use CoalesceEmpty(expression, default_value) function, for example:
CoalesceEmpty([Measures].[Store Sales], 0)
Comments
It is possible to write comments in calculation formulas. Use comments either to describe some non-obvious complex calculations or also commenting is valuable during debugging of the calculation formulas. When something is not working as expected then comment all formula lines and leave uncommented just some part of the formula that you would like to debug.
-- one line comment
expression -- comment until end of line
/* multi line
   comment
*/
Special comments with annotations
Available on Flex.bi cloud or Flex.bi Enterprise starting from version 3.1.
You can add special comments in the formulas with annotations for the calculated member. These annotations are used in the flex.bi user interface to group calculated members or to allow or disable certain actions:
-- annotations.group=...
Put the calculated member in the specified group in the Calculated members section of the dimension in the report builder.
-- annotations.disable_drill_into=true
Do not allow the Drill into action for this calculated member.
-- annotations.disable_drill_across=true
Do not allow the Drill across action for this calculated member.
-- annotations.disable_drill_through=true
Do not allow the Drill through action for this calculated member.
-- annotations.disable_drill=true
Disable all drill actions for this calculated member.
-- SOLVE_ORDER=1Changes solve order of calculated members.
List of all MDX functions
This tutorial covered the most frequently used MDX functions and examples on how to use them. If you didn't find what you need then take a look at the list of all MDX functions .
If you have any unclear questions or issues when writing the calculation formulas then contact flex.bi support .
Formatting
When creating a new calculated measure you can choose the format for the output of results.
If not selected, flex.bi would return a default format which sometimes is not correctly identified by flex.bi (for example, if calculation is the result of DateDiffDays() function)
You can choose between the following formats:
| Formatting | Comment |
|---|---|
| Numeric |
|
| Percentage |
|
| Date / Time |
|
| Duration |
|
| Size |
|
NEW Text |
flex.bi uses Font Awesome icons and it is possible to refer to them in a calculated measure when using markdown formatting, e.g. |
Custom | With this, you can change the result representation to another, e.g., For more details (and string templates) see how to Format string content. |