Support center for flex.bi version 4.0
Building a dashboard
- Laima (Deactivated)
- Gvido
- Miks Valers
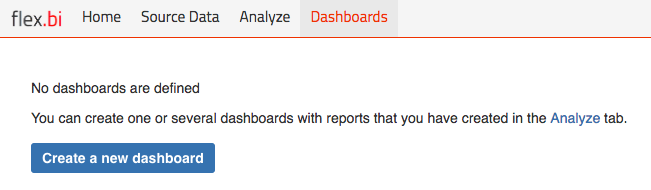
Create new dashboard page
Go to Dashboards tab and click Create new dashboard button.
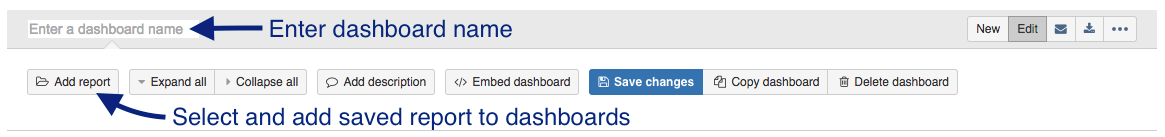
Specify a new dashboard name and select some existing reports that you would like to include in your dashboard.
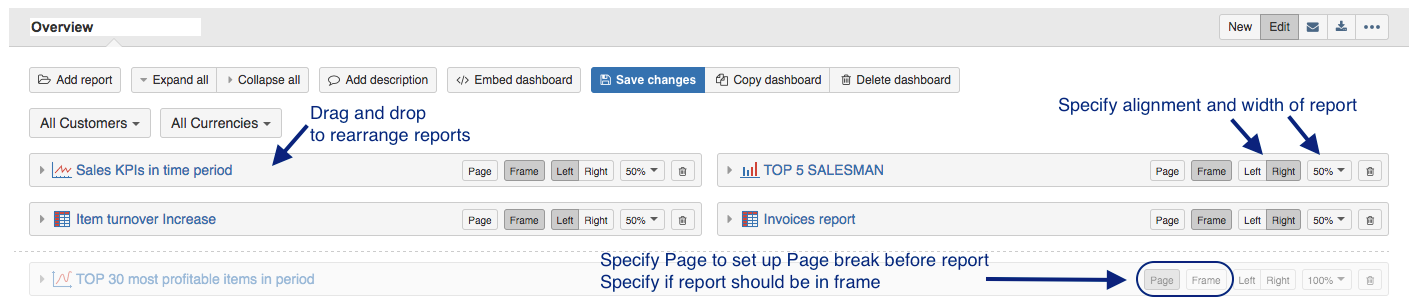
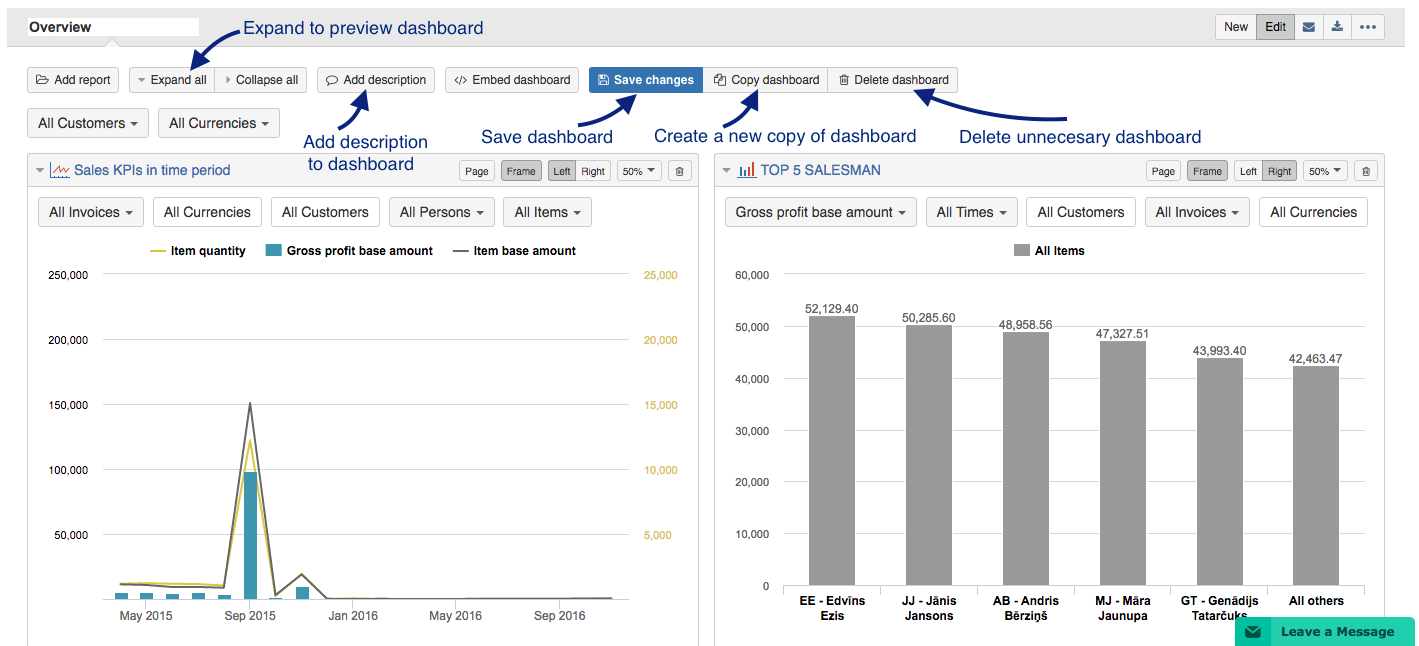
You can easily arrange reports in dashboard by
- specifying their width in percentage from all page
- specify if they should be aligned to left or right side of page
- rearrange reports using drag-and-drop
- add pagebreak after report and before next report begins
- add or remove frame around the report
After initial arrangement you can expand all reports and preview dashboard. If everything looks good then you can save your dashboard or continue rearranging reports if needed. You can also create a copy of existing dashboard (if you would like to create another dashboard page with some modifications) or delete unnecessary dashboards.
"Page" button is not available until PhantomJS is installed.
After saving a dashboard the dashboard will then have a unique URL address (e.g. sample demo dashboard have URL address https://flex.bi/bi/accounts/47/embed/dashboard/638). You can bookmark this URL in your browser for faster access.
If you later want to edit the dashboard layout then either double-click on the dashboard title or click the edit button or use the new button to create additional dashboard pages. You can also rearrange the sequence of dashboard pages by using the drag-and-drop function (when in dashboard edit mode).
Common dashboard page dimensions
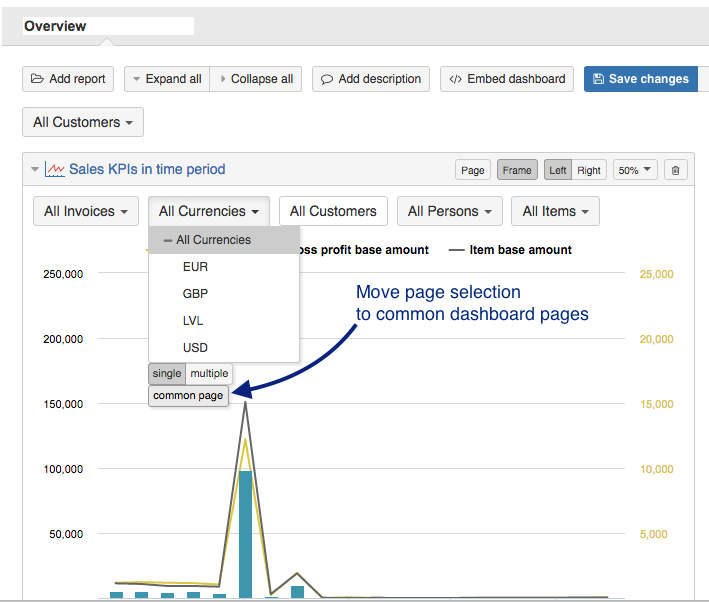
After saving the dashboard you can select the dashboard page dimension members and all of the reports which use this page dimension will refresh the results.
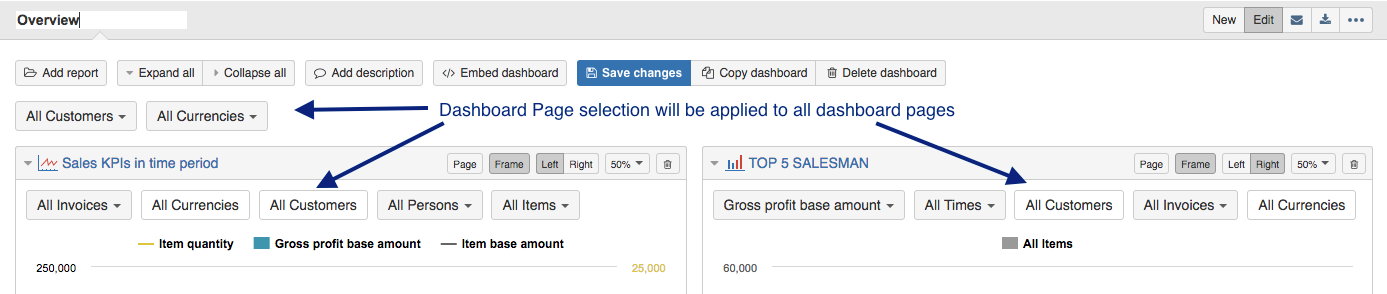
When you save a dashboard then all of the current common dashboard page selections are saved as well for this dashboard (and this dashboard will override default page selection in the included reports). All non-common report page dimensions after the dashboard page refresh will use default report page selection.
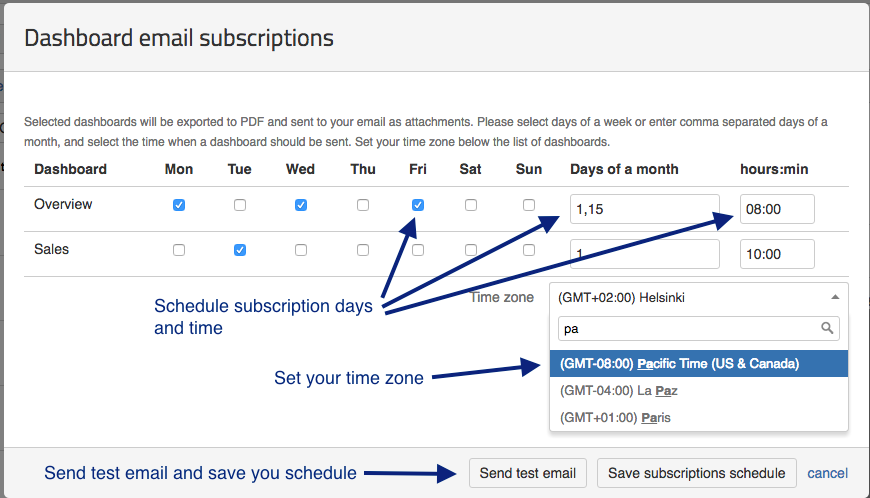
Dashboard email subscription
Automatic dashboard sending to email is available in STANDARD and BUSINESS subscription plans.
You can subscribe to receive a regular e-mail of your dashboards from the menu.

You will receive a PDF attachment to your account e-mail of all dashboards you have scheduled to be sent during half an hour time span. Please select week days or days of month to set how often you would like to receive emails.
Export and import dashboard definitions
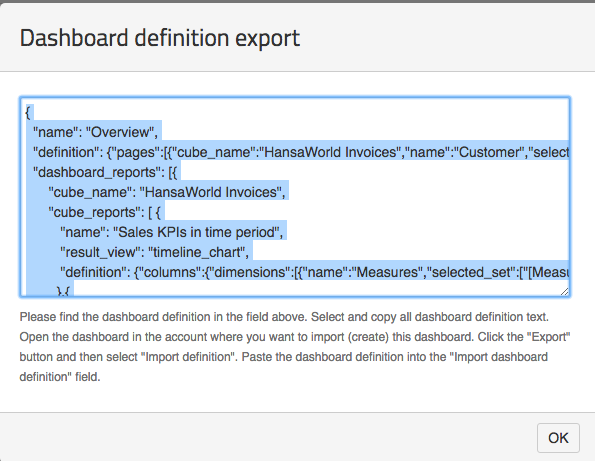
If you have several flex.bi accounts or several flex.bi environments (development, test, production) then you can export dashboard definitions from one flex.bi account and import into another.
To export dashboard definition click on the "Export "other report actions in report header toolbar and select Export definition.

You will see report definition in JSON format, please copy this report definition and paste it in the "Import definition" form in another flex.bi environment. Exported dashboard definition will also include all report and calculated member definitions that are used and needed for this dashboard.
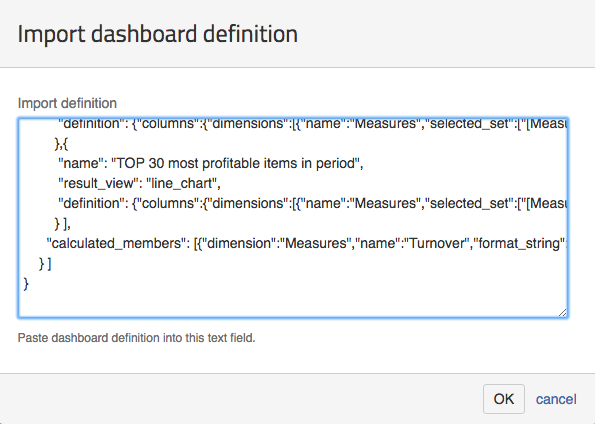
Now you can visit the other flex.bi account where you would like to import one or several exported dashboards and click Import definition.

In Import dashboard definition dialog paste previously copied dashboard definition and click "OK".
After import will be done you will be able to see and use imported dashboards in the new flex.b account.
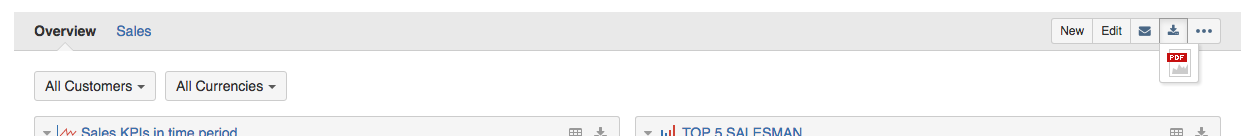
Export to PDF
You can export a dashboard to PDF.
If you are flex.bi Enterprise (Private Server) user and you don't see this option, contact administrator to install PhantomJS.