Support center for flex.bi version 4.0
Segmentation algorithm
- Gvido
- Miks Valers
By following the instruction in this solution page you will be able to create the following Segmentation algorithm report:
(PICTURE...)
The report live: https://flex.bi/bi/accounts/47/cubes/HansaWorld%20Invoices/reports/1896-current-month-forecast
Setting up Segmentation algorithm report
First, go ahead and follow the instructions on the Report templates library page to import the report's definition that is found here: https://flex.bi/bi/accounts/47/cubes/HansaWorld%20Invoices/reports/1896-current-month-forecast
Customising measure
To change the measure that the segmentation algorithm is shown by edit all of the calculated members "Medium 50000 - 60000", "Small < 50000" and "Large > 60000" that are found in "Measures" dimension. They should look like similar to this:
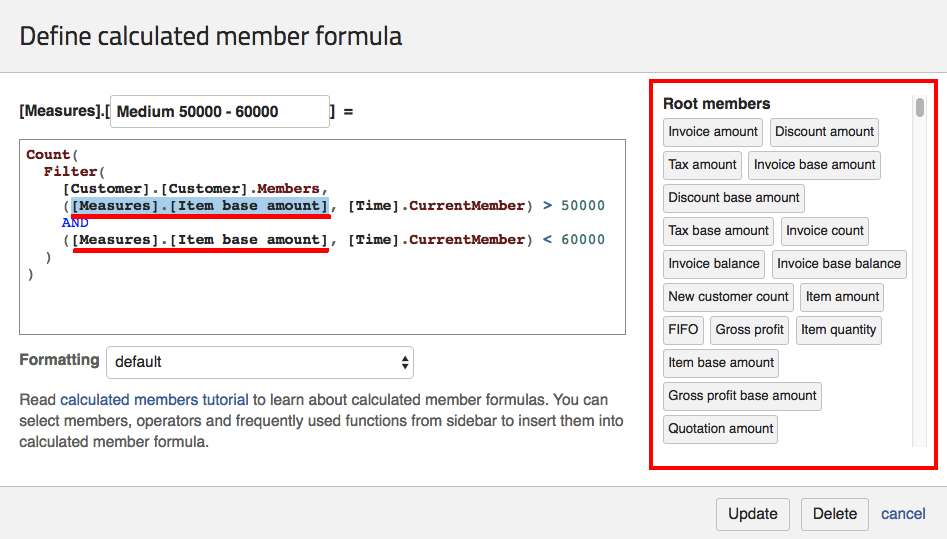
What you have to do is change all of the occurring [Measures].[Item base amount] measure that I have marked to one of the measures that are found in the calculated member list. You can insert the measure in the text field just by clicking on it. Find the member you want to use, click "update" and the calculated member will change to the measure you wanted.
For example, if you would like to see the customer segmentation for the default measure "Invoice count" then you would have to replace [Measures].[Item base amount] with [Measures].[Invoice count].
You can also freely edit the calculated member's name.
Customising data range
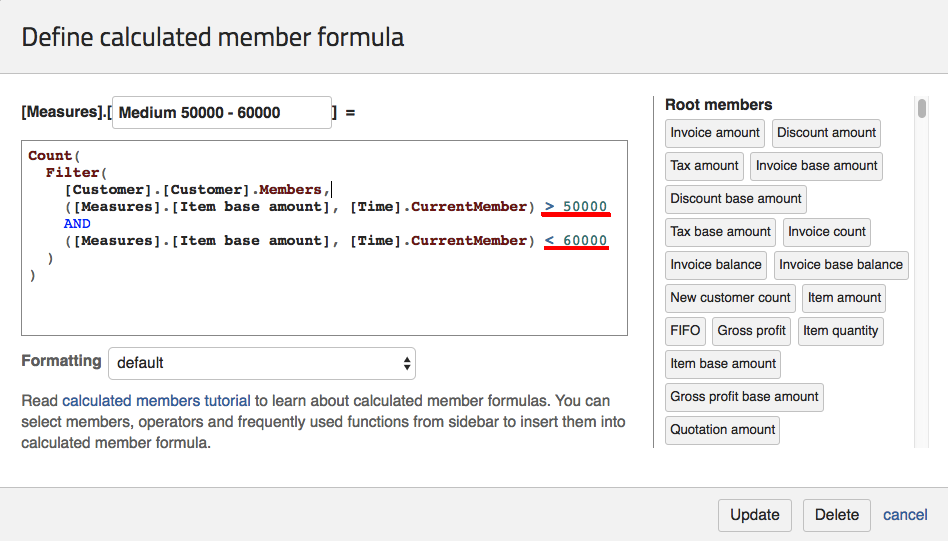
To customise the data range provide a valid condition.
In the example below the first condition makes sure that the customer base amount are above 50000 (> 50000) and the second condition makes sure that he customer Item base amount is below 60000 (< 60000). Together it makes for a data range from 50000 to 60000.
In the other calculated member you will see signs ">=" and "<=". The mean greater-equal and smaller-equal. If you don't use equal you might miss out on a customer that has the exact same value as specified.
You will also see that there is only one line instead of two. The reason for that is that with only line is enough to specify the data range. You can add more conditions yourself as well if you just remember to write "AND" after each condition. In a similar manner you can create now calculated member just by copying the formulas of existing calculated members and adjusting the measures and data ranges.