Support center for flex.bi version 4.0
Profit & Loss report
To re-create your profit & loss report in flex.bi you must follow these instructions.
1. Finding out what your HansaWorld Profit & Loss report contains
To first thing you need to do is find out what your Profit & Loss report is made out of. To do that you have to look at the Report Settings in HansaWorld. To do that:
1. Go to (Module) Nominal Ledger >> (Settings) Report Settings. You will see the following window:
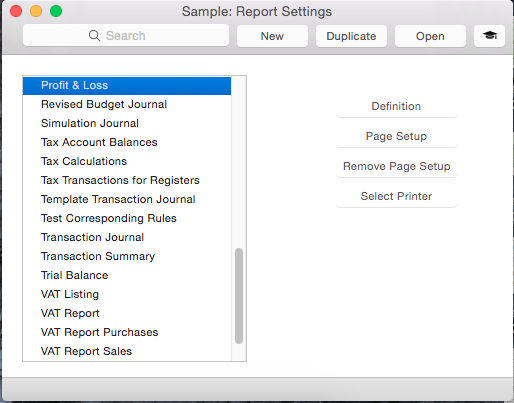
2. In Report Settings window (seen above), you have to find the Profit & Loss report. you can do this by entering Profit & Loss in the search window or browsing the list and finding it like that.
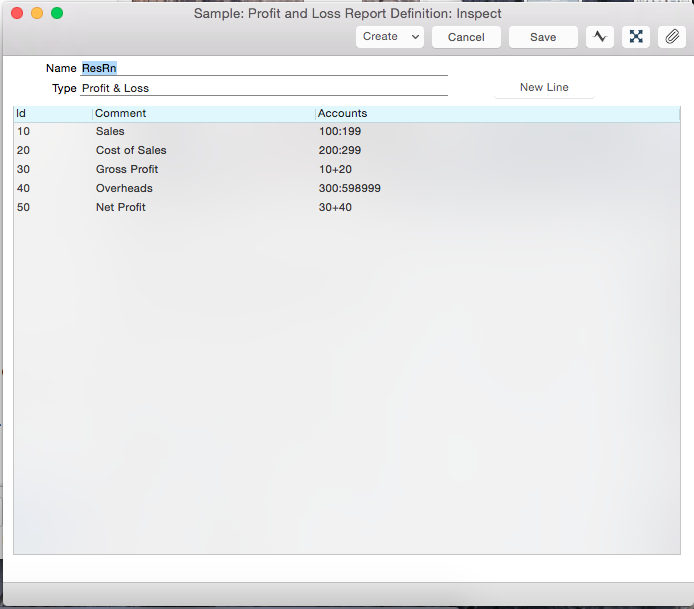
3. Open the Profit & Loss report Definition by double clicking Profit & Loss or pressing the open button in the top right of the Report Settings window. You should see the following window:
--------
Account groups or report Lines are seen in picture above. They can be following :
- Id - Account Group identification
- "Comment" name that will be displayed in report
- " Accounts" - Accounts or Account Groups that those groups consist of (Accounts).
------
This column use specialized way of displaying the amount of accounts a group contains by using the symbols ":" or "+".
The symbol ":" between two account numbers Interval of Accounts or Account Groups
The example shown in the image above :Accounts
(100:199)means that it is interval of the accounts from100to199(100, 101, 102, 103, ... , 198, 199)are included in this group
but the " + " defines Sum of Accounts or Account Groups , but it can be also " - "
Account group
(10 + 20)means the Sum of Account Groups created before (means that lines 10 + 20 are included in this group).
- As well as these can be Sum of Accounts
2. Re-creating the account groups in flex.bi
To recreate your account groups in flex.bi you will need to create Calculated members that aggregate the accounts you need into groups. First you have to pick a group you want to re-create, always try to work with one group at a time to make this task easier. By default you will have the groups Asset, Liability, Equity, Income and Expense created for you already. This example will contain several methods of aggregating accounts into groups:
- Defining Interval of Accounts
This example will show you how to aggregate accounts to recreate the Sales group visible in the Profit and Loss Report Definition image by using an interval method ( ":" symbol).
Upload all of the data needed for the financials cube as described here.
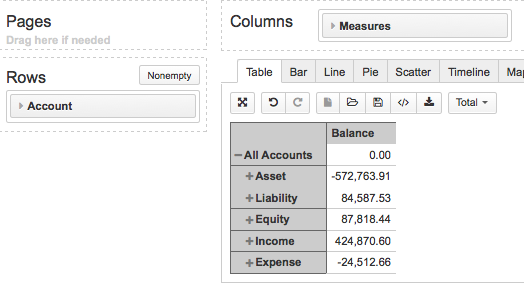
Navigate to the financials cube in flex.bi and start creating a new report. Place the Account dimension in the Rows section and the Measures in the Columns section. You should see something similar to this.
If you have any questions about this part please read about Basic concepts of Flex.bi and Report Creating Manual.
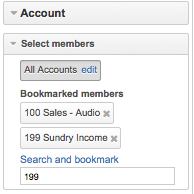
Selecting members: In the accounts dimension under Select members click on Search and bookmark, a text input window should open. In that window enter the account number of the account that is the beginning of the interval (in this case 100).
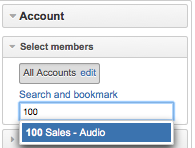
You should see an account appear in a list, press enter or click on the account that matches the number to create a bookmark (Visible in the image below). You must do the same for the end account of the interval (in this case account 199)
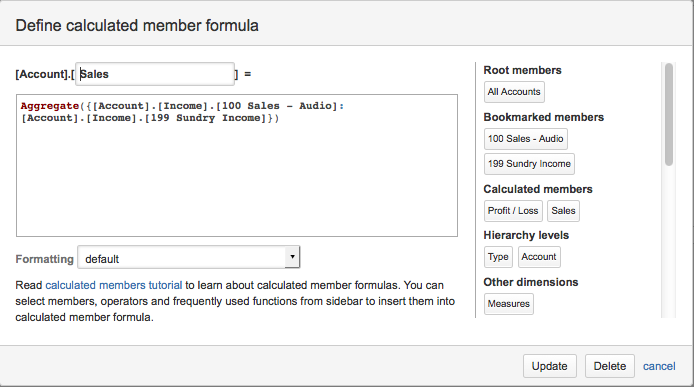
Creating Calculated member with aggregate function :
Formula : Aggregate ( { first member : last member } )
Now you will have to create a calculated member, calculated members are explained in detail here.
Create the following calculated member by entering the accounts by clicking on the bookmarks and connecting them with the ":" to create an interval.
- If you need to Interval from "100:199 " but without 177 then create one more calculated member and "-" 177 from total
- Intervals can be used for sequence of members ( in Account dimension ) or any other dimension
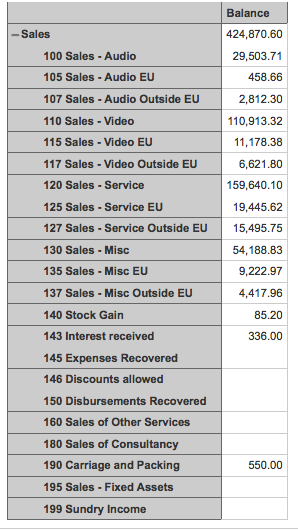
You should see the following result.
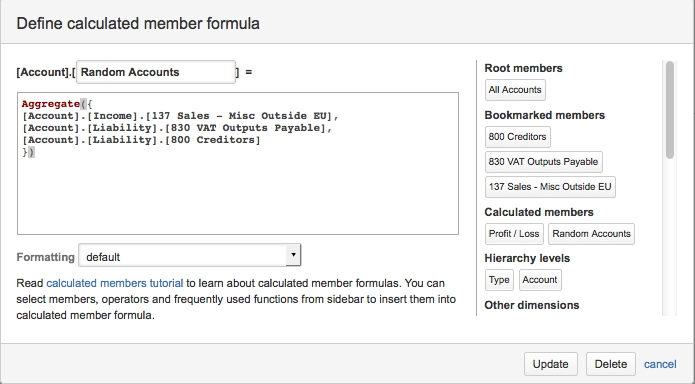
2. Defining SUM of Accounts or Account Groups
Option 1: Formula: Aggregate( {member, member } )
This example will show you how to aggregate three accounts using the sum method ( "+" symbol). When making the calculated member you have to remember that the "+" symbol will have to be replaced with a "," symbol.
You should see the following result.
Option 2: Formula: SUM( member, member )
Option 3: Formula: member + member + member
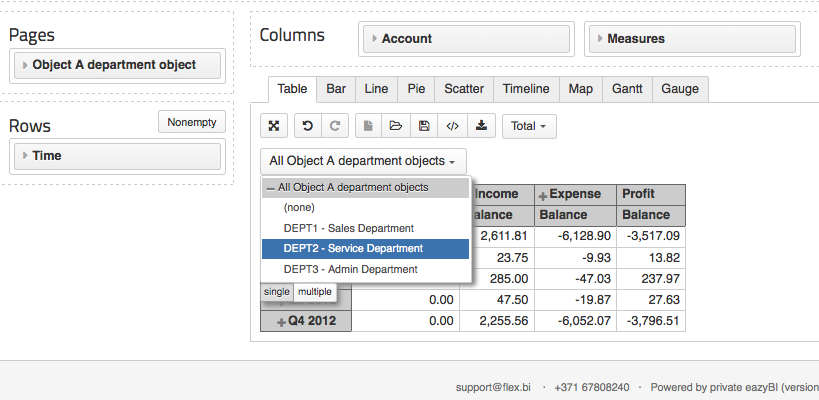
3. Limiting results by Object
Option 1: Object dimension in pages
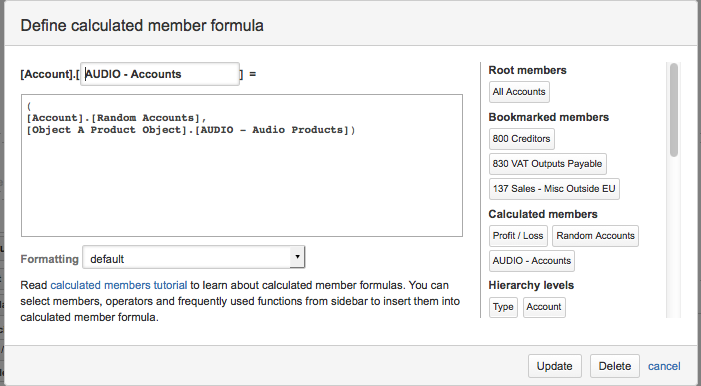
Option 2: Include object filter in Calculated member f account Group
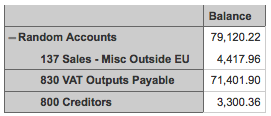
This example will show you how to only return the data of accounts that are connected to a certain object. In this example the values of the 3 Random Accounts created in the previous example will be filtered and aggregated into a single member AUDIO - Accounts. This member will return the account values that are connected to the object AUDIO - Audio Products.
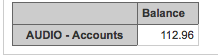
You should see the following result:
You can also include those in Aggregations or SUM. You can limit also by any other dimension existing - dividing by "," .
For example:
Account 211 , Object Audio , Object Other etc